
What Screen Time Tools Actually Track
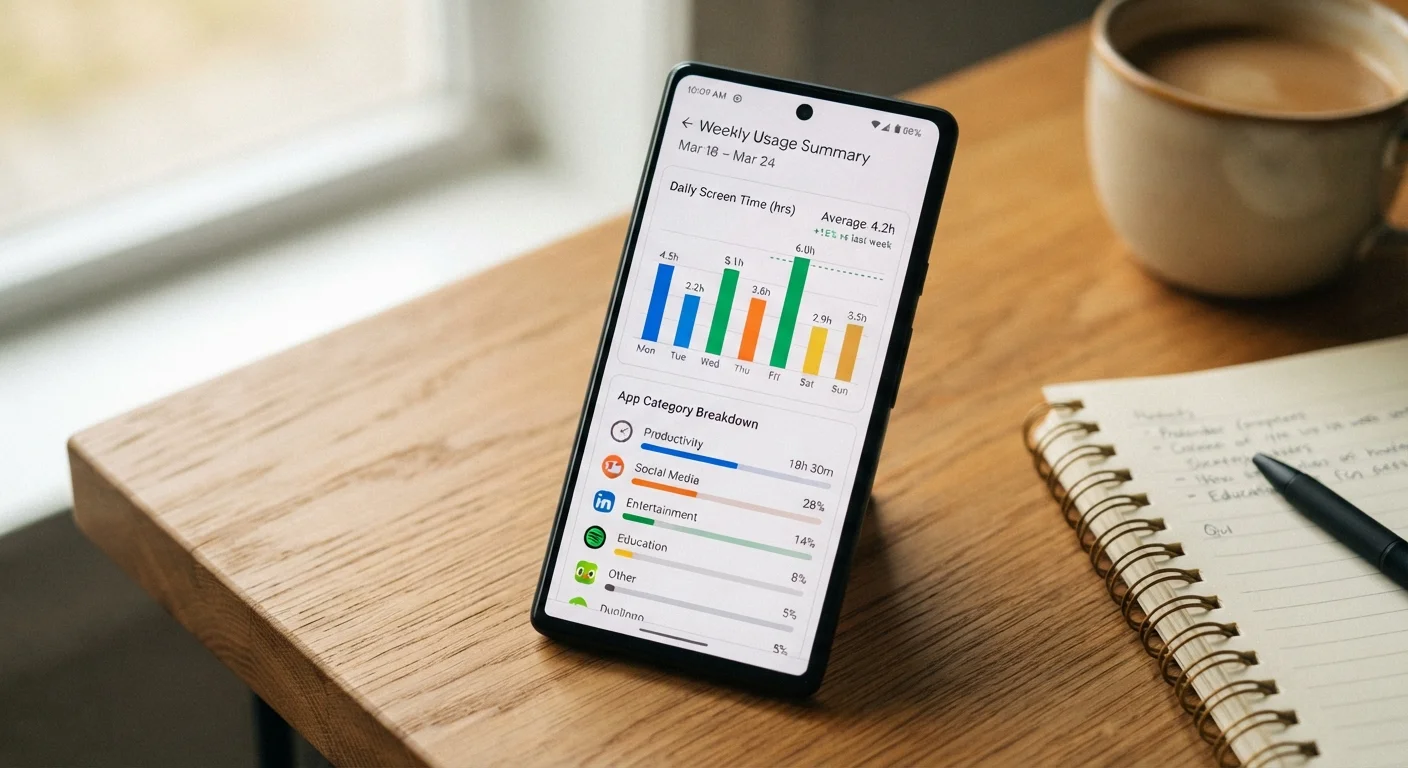
The screen time feature on your phone does one thing reliably: it records how long your screen was active and assigns that time to specific apps or categories. That's it. If your phone is unlocked and the app is open, the clock runs - regardless of whether you were deeply engaged, distracted, or simply forgot to close the app.
Most platforms group apps into broad buckets: Social, Entertainment, Productivity, Health & Fitness. These labels are assigned by the app developer or the operating system, not by your actual behavior. Reading long-form journalism inside a social media app registers as "Social." Using a meditation timer on your phone counts toward screen time just as a social scroll does.
What tracking tools do not record is equally important: they can't see your browser tabs, distinguish a video call from passive video watching, or tell whether you were multitasking. A two-hour screen session that was entirely a work video conference looks identical in the data to two hours of gaming.
Tracking Varies by Device and Platform
Apple's Screen Time, Google's Digital Wellbeing, and third-party apps each use slightly different methodologies for measuring and categorizing usage. Numbers from different tools may not be directly comparable, even on the same device. If you switch phones or operating systems, historical trends may reset or become inconsistent.
The Gap Between Time and Experience
Raw hours are a quantity metric, not a quality one. The distinction between passive and active screen use illustrates this clearly: creating a presentation, video chatting with a family member, and mindlessly refreshing a feed all register identically in your usage summary, even though research suggests they carry meaningfully different implications for focus, mood, and wellbeing.
Similarly, purpose matters. A caregiver using a tablet to manage medical appointments is doing something categorically different from the same duration spent watching autoplay videos - yet the dashboard treats them as equivalent. Identical totals can represent entirely different realities.
4.8 hrs
Average daily smartphone use among U.S. adults
According to data compiled by research firm DataReportal, American adults spend close to five hours per day on their smartphones on average.
7+ hrs
Average daily screen exposure including TV and computers
When all screens are combined - phones, computers, and televisions - total daily exposure for U.S. adults typically exceeds seven hours, per estimates from Nielsen and similar audience-measurement sources.
~40%
Teens who say screen time limits miss the point
A Pew Research Center survey found a substantial share of U.S. teens believe discussions about screen time focus too much on quantity and not enough on what they are actually doing online.
This is why many researchers now argue that context-free hour limits - whether self-imposed or recommended - are a blunt instrument. The American Psychological Association and others have noted that the field is moving toward more nuanced frameworks that weigh content, purpose, social context, and displacement of other activities.
What the Numbers Leave Out
Screen time data has several structural blind spots worth understanding before drawing conclusions from it.
- Cross-device gaps: Your phone tracks your phone. Your laptop, smart TV, and gaming console each operate independently. If you spend three hours watching a streaming service on a television, that time is invisible to your phone's tracker.
- Background activity: Music apps, navigation, and podcasts running in the background may or may not be counted, depending on the platform and settings.
- Social and emotional context: The data doesn't know whether you were alone or with others, stressed or relaxed, choosing freely or using a screen to cope with something difficult.
- Sleep displacement: Tracking tools don't flag whether late-night screen use cut into sleep - one of the most consistently documented concerns in the research literature.
Understanding your own digital behavior requires looking beyond the summary screen. Our guide to understanding your digital habits is a practical starting point for building that self-awareness.
Using the Data Thoughtfully
None of this means screen time data is useless. As a first-pass signal, it can surface patterns worth examining - an unexpectedly high total, a category you didn't realize dominated your day, or a trend that's crept up over several weeks. The key is treating it as a prompt for reflection rather than a verdict.
A few questions worth asking when you look at your usage summary: Does this time feel intentional or habitual? Did it displace something you value - sleep, exercise, in-person connection? Does the category breakdown reflect how you actually want to spend your attention?
If you want to go further, a structured weekly review can make the data actionable. The Building a Weekly Screen-Time Audit guide walks through a judgment-free process for interpreting your numbers and identifying what - if anything - you'd like to change. Screen time, in the end, is a mirror that shows one narrow reflection. What you do with that reflection depends on the questions you bring to it.
Look at Patterns, Not Just Totals
Instead of reacting to a single day's number, review a week or month of data to spot trends. Ask yourself whether high-usage periods align with stress, boredom, or specific activities - that context tells you far more than the daily average alone. For a structured way to do this, see our guide on building a weekly screen-time audit.